HEAT MAP ON HOMES BUILT BETWEEN WW1 & WW2
20 second read.................
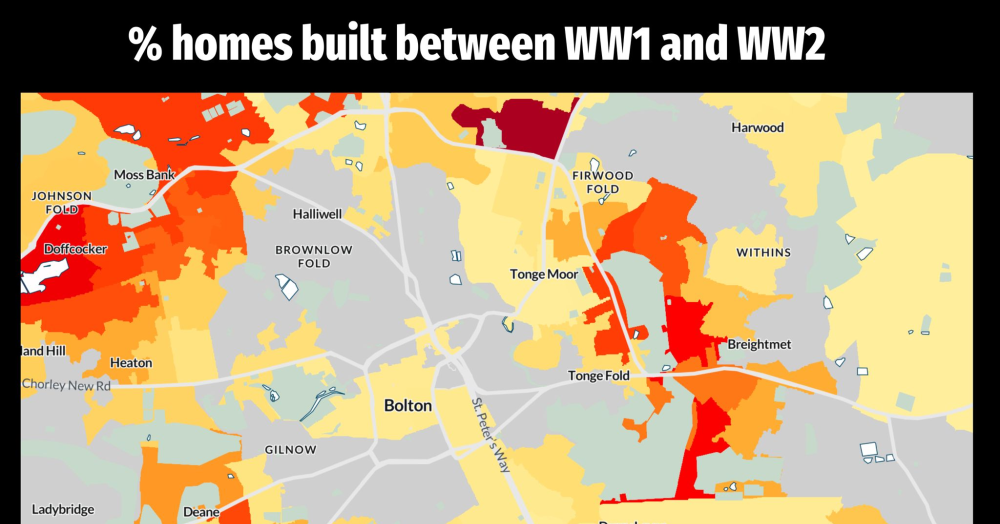
This heat map of Bolton visually highlights the areas with homes built between World War I and World War II. The darker the red regions represent the areas of Bolton that have a higher concentration of homes from this period. These areas stand out against the grey regions, where no homes from that era exist.
The interwar period was marked by a challenging economic landscape. The Great Depression of the 1930s caused widespread unemployment and reduced economic activity, making home construction difficult. Additionally, funding for public housing was limited, and high-interest rates deterred private investment. Social unrest and political instability further dampened growth in the property market.
Despite these conditions, certain areas in Bolton experienced growth, reflecting the changing housing needs and the influence of early urban planning efforts. This graphic provides a fascinating insight into the town's development and offers a window into a unique chapter of British housing history.
Thank you for reading.
Aliaa
aliaa@harrisonsnet.co.uk